S‑Parameter Plotter & Smith Chart Viewer
Unlock deeper RF insight with PMI’s Integrated S‑Parameter Visualization Suite—a powerful, built‑in analysis tool that transforms raw Touchstone data into clear, actionable performance intelligence. Product pages that include downloadable S‑parameter files are displayed in the interactive viewer that lets engineers instantly explore gain, return loss, VSWR, phase, and impedance behavior across the products operating band.
The advanced plotting engine delivers high‑resolution magnitude and phase charts, real‑time Smith chart interaction, and multi‑trace overlays for comparing units or evaluating performance consistency. Hover anywhere on the Smith chart to reveal precise R + jX impedance values, or switch to rectangular plots to assess insertion loss, reflection coefficients, and group delay with exceptional clarity.
Designed for speed, accuracy, and convenience, PMI’s S‑Parameter feature gives RF designers the confidence to validate performance, optimize matching networks, and accelerate system‑level decisions—right from the browser, with no external software required.
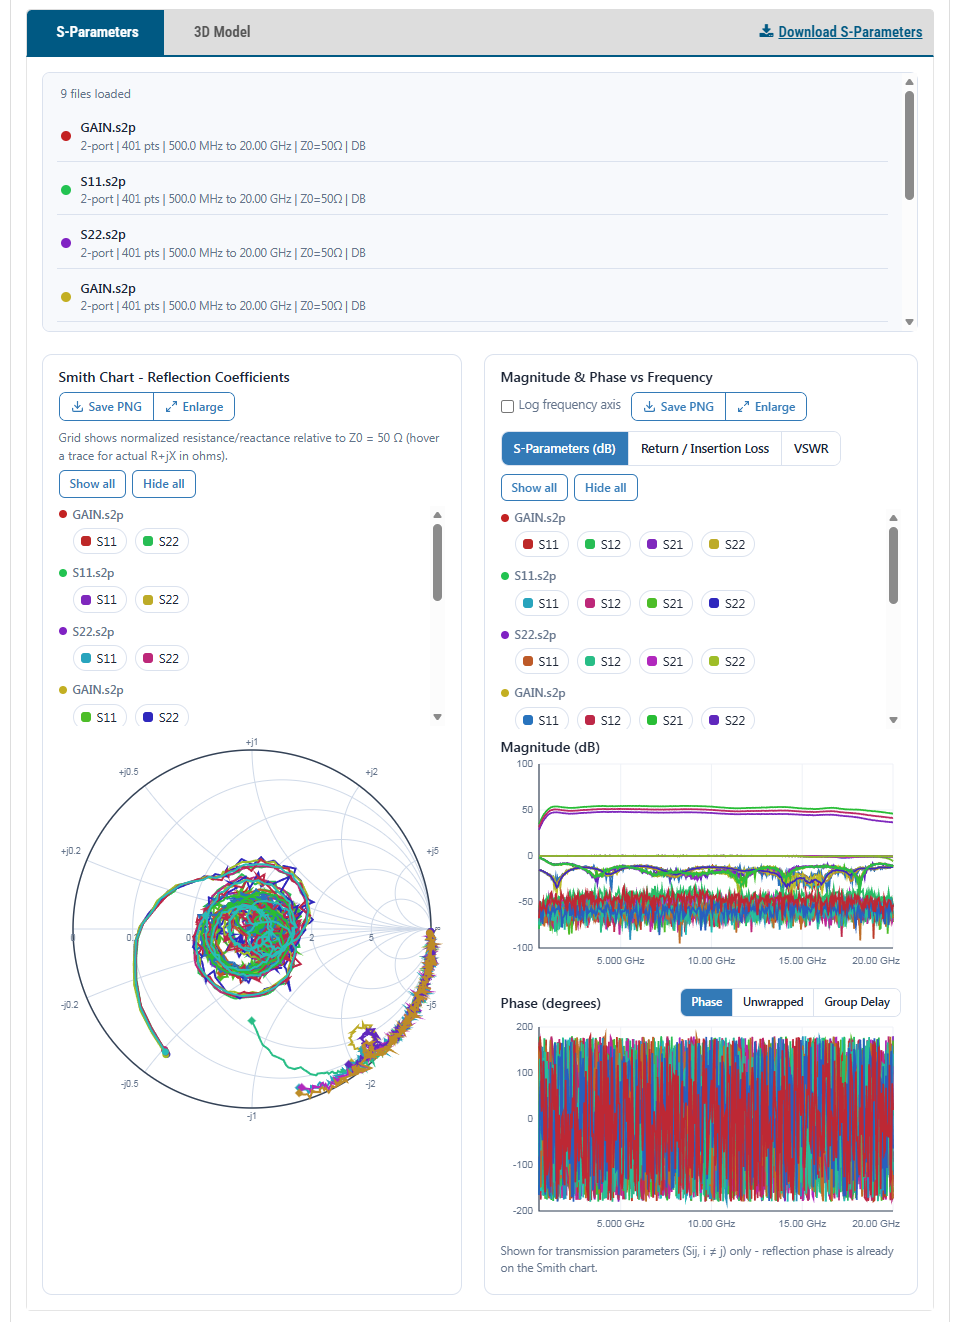 Typical S Parameter Plot Example
This page explains how to visualize RF S‑parameter data using an interactive this online tool. It walks through each type of plot the tool generates, how to interpret them, and what “good” RF performance looks like.
📂 What the Tool Does
Lets you view the uploaded product Touchstone (.sNp) files to instantly visualize S‑parameters on:
Smith charts (reflection coefficients)
Magnitude & phase plots
Return/insertion loss
VSWR
Group delay
Supports comparing multiple files, temperatures, or lots side‑by‑side with no software installation.
Tool has ability to open a larger view of the data or save plots in .png format.
📈 How to Read Each Plot
The page provides detailed guidance on interpreting RF measurements:
Smith Chart
Shows reflection coefficient (Γ) and impedance.
Center = perfect 50‑Ω match (no reflection).
Rim = total reflection.
Good RF parts stay clustered near the center across the band.
Magnitude (dB)
Displays S‑parameter size vs frequency.
S21/S12 = transmission; S11/S22 = reflection.
Passive parts show negative transmission (loss); amplifiers show positive gain.
Return & Insertion Loss
Same data as magnitude but sign‑flipped.
Higher return loss = better match. (20 dB → 1% reflected)
Lower insertion loss = better throughput.
VSWR
Another way to express reflection.
Perfect match = 1.00:1.
Table converts VSWR ↔ return loss ↔ |Γ| ↔ reflected power.
Phase & Group Delay
Shows transmission phase and delay.
Unwrapped phase reveals linearity.
Group delay = time signal takes to pass through device. Flat delay preserves waveform integrity.
📄 File Format Overview
Explains how .sNp files are structured:
Option line defines units, parameter type, format, and reference impedance.
Two‑port files (.s2p) use a unique ordering: S11, S21, S12, S22.
3+ port files use row‑major ordering.
Noise parameters may appear after S‑parameters.
Download S Parameter Data
Link allows for downloading the product .sNp files contained in .zip format.